Avoid losing data and availability of functions in large-scale IoT systems
What happens when data from electronics become part of a supply chain? And what should you consider when rolling out large wireless networks in an IoT context?
Availability drives IoT development
The Internet of Things (IoT) is the interconnection via the internet of computing devices embedded in objects, enabling them to send and receive data. When rolling out IoT infrastructure on a large scale, you may face system breakdowns, causing data loss due to the environmental factors, network errors, differences in installation, variation in sensor data and the system's overall integrity. Maintaining the availability of these functions is essential. Here, we dive into what happens when you have passed the proof-of-concept phase in a controlled environment and data from electronics become part of a supply chain - and what you need to consider when rolling out large wireless networks in an IoT context.
Reliable IoT networks are a vital ingredient in solid supply chains
As more companies adopt IoT, many are shifting from selling products to offering services based on functionality. For example, in the case of lorry tracking, it is crucial for the transport company that data regarding the location of each lorry is delivered reliably. Transport companies might lack the resources to administer and run a data network and perform device maintenance. That is why they often work with a system supplier they evaluate based on the service provided, namely reliable delivery of data from the devices. This makes the electronics and the network part of the supply chain required to deliver the service. Therefore, the reliability of these components must be considered and prioritised when managing the supply chain.
Deliver reliable data through certified wireless coverage
Wireless coverage is foundational to IoT networks. Sigfox, a wireless network devoted to IoT, has a certification programme that tests IoT devices against various parameters to ensure reliable data transmission. One parameter is the antenna implementation. Devices are tested to determine how good their antennae are, which directly influences the coverage level experienced by end-users.
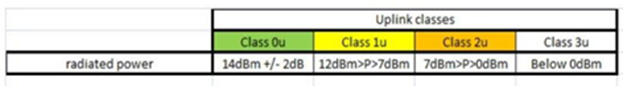
Figure 2 outlines four classes of devices based on their antenna performance, with direct implications for connection reliability and service quality.
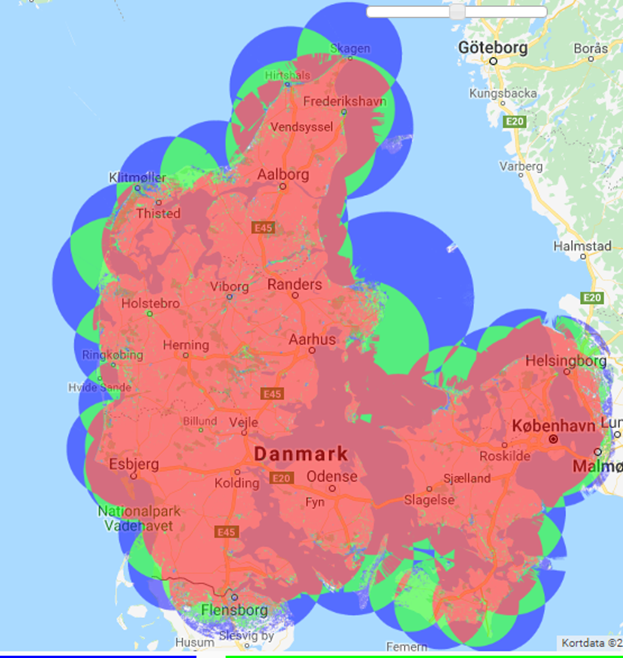
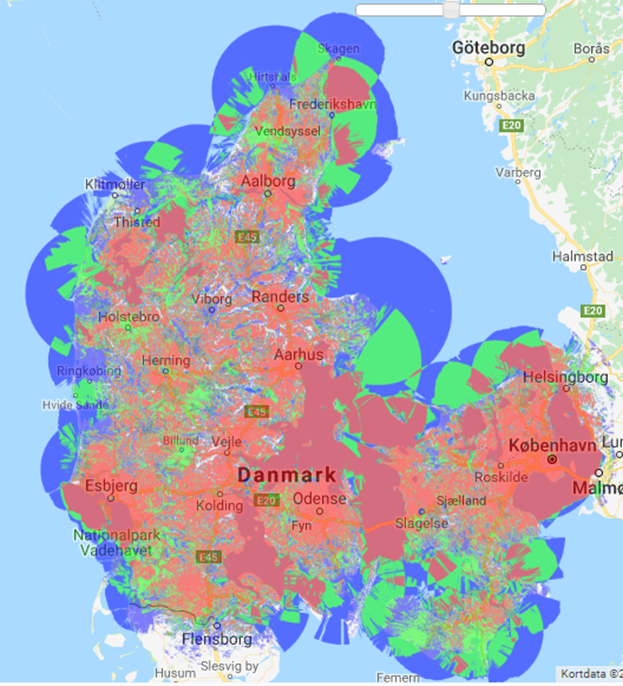
In Figures 3a & 3b illustrate Sigfox coverage in Denmark, highlighting the importance of good antenna performance in ensuring robust national coverage.
Ensure quality by evaluating devices statistically when going from proof-of-concept to large-scale IoT rollouts
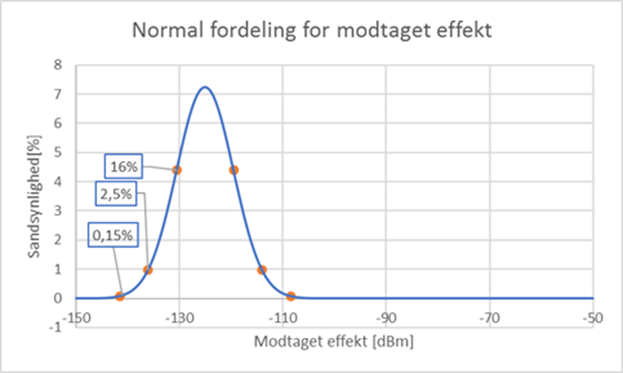
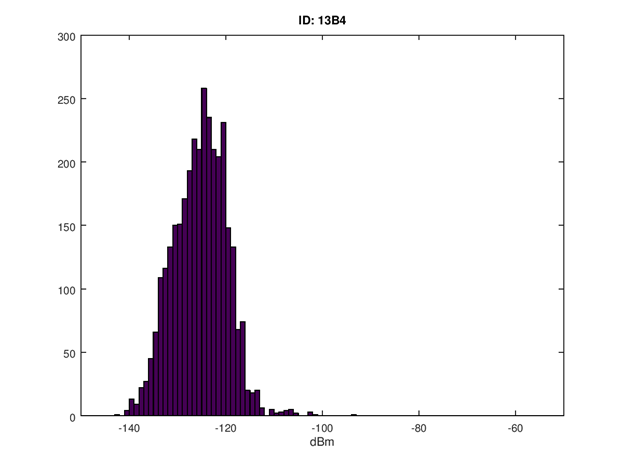
In POC projects, we often demonstrate that coverage exists and is sufficient for the system to fulfil its purpose. But when we roll out thousands of devices throughout the country for long-term use, it is essential to take a statistical approach to coverage. Most often, a normal distribution can be used to evaluate the quality of signal strength nationwide - and by extension, the quality of the service delivered (see example in figure 4).
FORCE Technology monitored first IoT smart village in Scandinavia
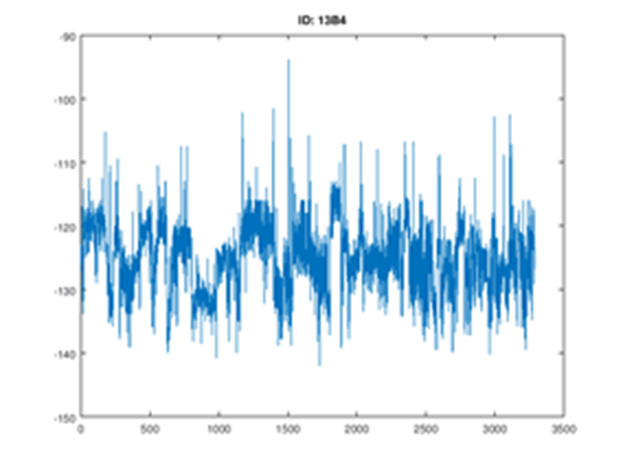
In Svebølle, where the Danish energy company SEAS created the first "smart village" in Scandinavia to test IoT technology, sensors monitor various infrastructure elements like parking, street lighting, and utility meters. FORCE Technology monitored LoRA-based wireless communications as part of the Energy Bigger project.By evaluating performance through radio network data, we were able to assess device reliability even without access to sensitive data. Figures 5a and 5b illustrate how the received power of a single device impacts data transmission, and how antenna quality plays a critical role in minimizing packet loss.
Consider the probabilities when scaling IoT systems
The larger the IoT network and the longer the devices are in the field, the greater the exposure to environmental extremes. For instance, a network of 10,000 devices operating for 10 years will collectively endure 100,000 years of operation, increasing the likelihood of extreme conditions affecting device performance. This underscores the importance of considering statistical probabilities when planning large-scale deployments to ensure long-term data availability and service reliability.
Ready to scale? Contact us to optimize your IoT system
Ensuring consistent data availability and system reliability is crucial for delivering services and products in a large-scale IoT environment. Let us help you design, install, and test your IoT infrastructure to ensure it meets your needs for long-term success.

Michael Vaa
the article was published in

IoT & Wireless Club
Read more and join the IoT & Wireless Club.