How to calculate the lifetime of an electronic product
Knowing the lifetime of an electronics product is vital when assessing and documenting the product reliability. Read about the exciting new initiatives, like the Lean Mean ALT Lab.
Electronics play a crucial role in ensuring that pretty much all modern products and systems function correctly. Knowing the lifetime of an electronic product is therefore vital when assessing and documenting the reliability of the system.
We are constantly being given more and improved opportunities to make detailed calculations and simulations in the development of new products. Even though we don’t need so many physical tests as we did in the ‘good old days’, physical testing is still needed to obtain practical data on the lifetime of electronics. In this article we discuss some of the exciting initiatives that FORCE Technology works with in its physical testing to determine the lifetime of electronics used in completely different situations.
Understanding the reasons why products fail
The general term for this work is called the Physics of Failure. In a nutshell, this deals with understanding the basic mechanisms (failure mechanisms) that lie behind failed electronics, when you get right to the root of the problem. The word physics is used in its broadest sense, as we also work with chemical causes, for example. Once we know the ways in which a new product can fail (failure modes), we can find the fundamental failure mechanisms, which, together with an analysis of the stress factors the product will be subjected to throughout its lifetime, we can use the ‘Acceleration Models’ to find a connection between the lifetime in ‘reality’ and when subjected to an Accelerated Lifetime Test (ALT) conducted in the laboratory. Mapping the stress factors which a product is subjected to during its lifetime is called a Mission Profile analysis. Naturally, there can be many different scenarios involving stress factors for a particular product’s lifetime (my children’s mobile phones will without doubt be subjected to more stress than my own phone!).
It is this form of testing with the relevant stress factors that will be conducted in the Lean Mean ALT Lab, which FORCE Technology is in the process of establishing as part of our work with Physics of Failure. Lean Mean ALT Lab is a working title whereby Lean indicates that it is an effective laboratory and Mean denotes that we test using extremely powerful stress factors – preferably at the same time! ALT refers to the purpose of the laboratory, which is to use Accelerated Testing to determine the Lifetime.
Various types of reliability tests
There are many different types of test that can test the robustness and reliability of an electronic product – here is a short summary:
By conducting a Design Verification Test (DVT) we focus on external stressors, i.e. stress factors that are determined by the surroundings (environment). This could be the maximum air temperature including additional heat from the sun for outdoor equipment, for example, or the vibration level in a working tractor. The purpose of this type of testing is to verify that the equipment fulfils a set of specific minimum requirements.
In a so-called robustness test, we will often perform a violent forcing of external stress factors, in order to find the product’s weak points as quickly as possible. One example of this is a thermo-mechanical Highly Accelerated Limit Test (HALT), where we subject the product rapidly to extreme temperature changes while simultaneously vibrating it more and more violently. The purpose of these tests is to find the product’s weak points so that we can improve its design.
When we carry out the ALT test, we look at all the stress factors that help wear out the lifetime, i.e. both external stress factors (external loads) and the stress which the product imposes on itself (functional loads). You could say that the ALT test lies somewhere between the DVT and robustness test. The purpose of ALT testing is to find the functioning lifetime for one or more sets of specific usage scenarios.
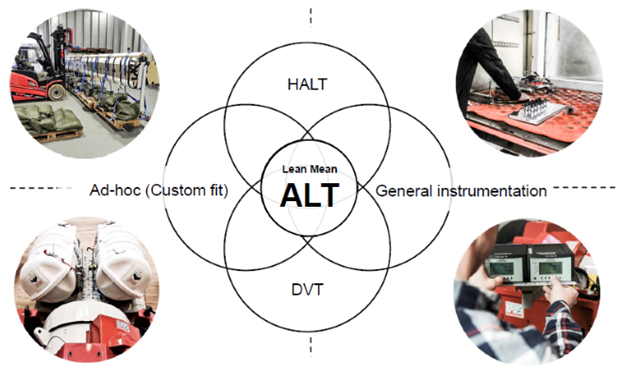
Figure 1 illustrates the extent to which a Lean Mean ALT Lab can be said to function somewhere between a DVT Lab and a HALT Lab; but also that general instrumentation equipment will also be used and ad hoc equipment built that can be adapted to the specific product and the functional loads that are relevant.

In order to prevent the Lean Mean ALT Lab becoming an abstract concept and thus partially incomprehensible, here are a couple of examples of conducted tasks:
Example 1: LED lighting including power supply
Although at the start LED lighting was presented as a replacement for conventional light bulbs with a virtually infinite lifetime, we know that light diodes suffer from wear just like all other forms of electronics and will demonstrate a drop in luminous efficiency over time. In other words, LED lights have a limited lifetime which depends on how much light loss one is prepared to accept. It is important to remember that lifetime of a power supply, which is almost always somewhere between the 230Vac mains source and the light diodes themselves, must also have a lifetime that matches the light source.We have ALT tested this by subjecting the actual LED light source and the corresponding power supply to a test using three different high temperatures while repeatedly turning the light on and off. The frequency of the on/off action triggers numerous rapid temperature fluctuations for electronics and light sources, as these naturally become warmer when put into effect. Here, the stress factors are a high temperature and rapid temperature fluctuations. By applying a relatively simple measurement of the luminous efficiency, taken at regular intervals, we can find the parameters for a suitable acceleration model so that we can determine the lifetime for different usage scenarios. Here, the lifetime will be the time until a marked decline shows in the luminous efficiency. This could for example be when the luminous efficiency has dropped to 80 % of what a new light source has. The acceleration model is based on the Arrhenius equation. Testing was naturally conducted with more samples in order to get an impression of the deviation between the different samples, so that an assessment could be made of the statistical uncertainty of the results (confidence).
Example 2: Slip ring system
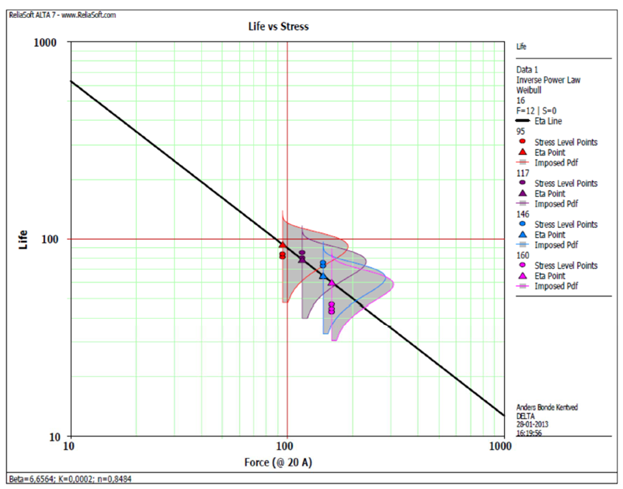
A slip ring system is often used to transfer electric supply voltage from a stationary component to a rotating component via some brushes or carbon, which slide on a commutator. This could for example be a generator or in a DC motor, such as in the starter motor of a car. As the carbon brushes move in relation to the commutator, there will naturally be some wear to these brushes over time. If the carbon wears too far down, the electrical connection can become unstable or disappear completely.The most important stress factors in this specific case were assessed to be the current that runs through the carbon and the force by which the carbon was pressed against the commutator. A test program was therefore created with various combinations of current and spring forces. The temperature also plays a role, but it is only increased indirectly due to the increased current and increased rotation speed during the test. The lifetime was defined as wear on a specific minimum thickness of the carbon. Tests were carried out with four values of current and four values of spring force, with a total of 20 test objects used (sets of carbon). The test was conducted as a Dual Stressor Calibrated Accelerated Life Test (Dual stressor CALT), so that we could determine the influence of current and spring force on the lifetime, both individually and in combination. The first curve below shows lifetime as a function of spring force with constant current.

As all the test results were achieved, a total analysis was carried out of the parameters for the acceleration model for current and spring force. The acceleration model here was based on the so-called Inverse Power Law, which can often by applied with mechanical wear phenomena.
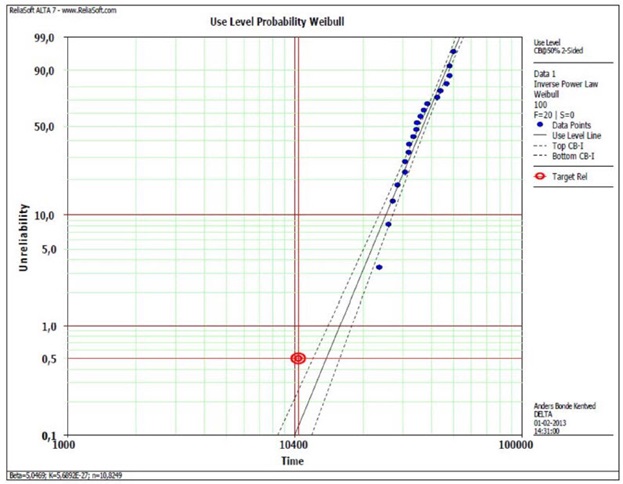
The results of this type of analysis can be shown in many different ways, with the curve in figure 3 being one of the most used. This shows the anticipated number of defects (shown as a percentage) for all test results calculated on the basis of normal operation as a function of hours in operation. A defect is still defined as a wearing down of the carbon to a specific limit. The blue dots represent the individual test results, the black line the best fit, the dotted line indicates the statistical uncertainty and the red dot the desired lifetime. The results can be used directly to define appropriate service intervals. A full description of this example can also be found in the SPM report 181 “Practically applicable reliability tools,” published by SPM in June 2013.

Examples 1 and 2 show we have used temperature, temperature fluctuations, current, and force as stress factors. In our forthcoming Lean Mean ALT Lab we will also be able to perform tests using many other stress factors and combinations of these. These could for example be: movement, torque, pressure, electric potential, electric oscillations, vibration, and moisture – all with the purpose of determining the lifetime for a specific product used under different operating conditions.


