Traffic noise is dangerous to our health – but what do we do about it?
Noise nuisances is an emotional and attitudinal reaction from a person who is exposed to noise in a given context.
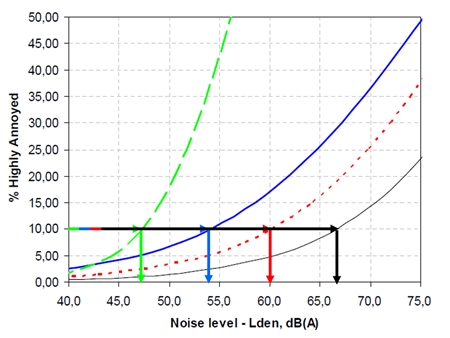
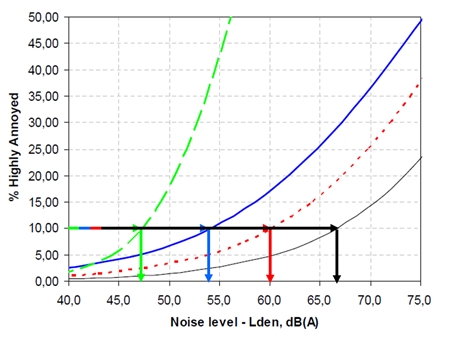
The relationship between noise levels and perceived noise nuisances is determined using so‑called dose–response curves. These curves show what proportion of the population will feel annoyed when exposed to a given noise level. For example, 10% of the population will feel highly annoyed at 47 dB from wind turbines and 67 dB from railways.
The average level of noise nuisances depends, among other factors, on the source that causes the noise.
Dose–response curves for noise from wind turbines, aircraft, roads, and railways.
In Denmark, there are approximately 724,000 homes* where road traffic noise exceeds the Danish Environmental Protection Agency’s recommended limit value of 58 dB (Lden). For comparison, there are 7,000 homes where the limit for railway noise of 64 dB (Lden) is exceeded, and about 1,800 that are exposed to aircraft noise above the limit value. Of the 724,000 homes affected by road noise, about 16% are located along state roads and about 84% along municipal roads.
The number of noise‑exposed homes depends on the limit value set for the given noise source. The difference in limit values for road noise and railway noise is due to earlier documented differences in people’s perceived annoyance from road versus railway noise. The so‑called “rail bonus” is now being questioned, and WHO’s expert panel has most recently assessed that the difference in limit values should be around 1 dB instead of 6 dB.
Dose–response curves for noise from wind turbines, aircraft, roads, and railways.
By Per Finne & Torben Holm Petersen, Force Technology
Every year, 200–500 Danes die prematurely due to traffic noise, but political attention and resources to reduce the problem have been limited. To address this, new methods are needed to increase understanding of how noise affects human health.
Traffic noise is a slow killer
When exposed to noise, you experience noise nuisances that may give rise to stress.
The extent of noise nuisances depends on several factors, including the time of day, what the person is doing, and the person's noise sensitivity. On average, noise nuisances increase with noise levels, and with prolonged exposure to noise, stress symptoms can develop into diseases and ultimately result in premature death.
Road noise is the absolute biggest source of noise nuisance. But, unlike road fatalities, it is not possible to name those who die from traffic noise. Thus, noise is a slow killer, causing an increased risk of disease and death just as certain cancers and lifestyle diseases.
The scale of the problem is large. Figures from 2012 show that approximately 724,000 Danish dwellings, the equivalent of about 1.4 million people are exposed to noise that exceeds the Danish Environmental Agency's guiding noise limits.
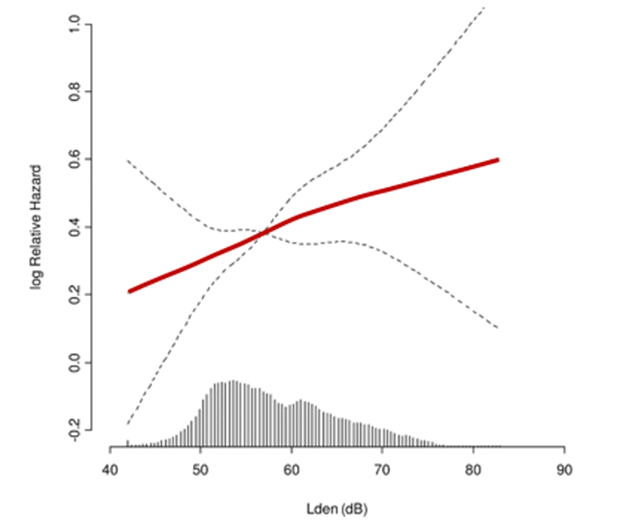
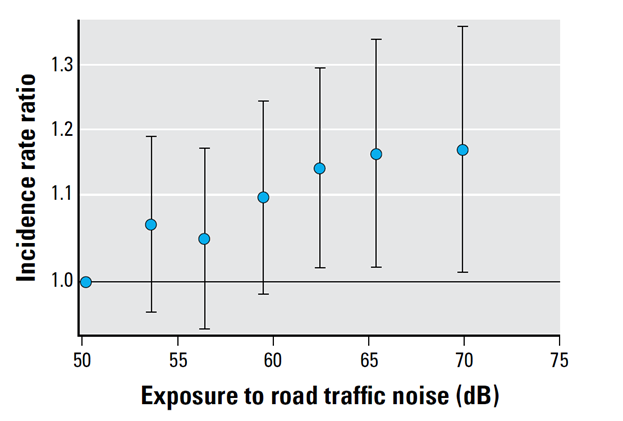
Many studies have investigated the correlation between prolonged noise exposure from traffic and reduced quality of life. The figures below show a clear correlation between the level of road noise exposed to at home and serious illnesses.
The correlation between the level of noise at home and the relative risk of a bloodclot in the heart. The risk is adjusted to include air pollution, lifestyle, smoking, intake of fruit and vegetables, etc. The red line indicates the correlation and the dotted curves 95% confidence intervals. The vertical lines above the x-axis indicate the number of observations at the different noise levels. Source: Sørensen M, Andersen Z J, Nordsborg RB, Jensen SS, Lillelund KG, et al. (2012):”Road Traffic Noise and Incident Myocardial Infarction: A Prospective Cohort Study”, https://doi.org/10.1371/journal.pone.0039283The correlation between exposure to road traffic noise at home at the time of diagnosis and the occurrence of diabetes. The figures are adjusted to include, for instance, lifestyle BMI, smoking, intake of fruits and vegetables, smoking, and air pollution. The y-axis indicates the occurrence compared to a group of people exposed to a noise level of Lden = 52 dB. Source: Mette Sørensen, Zorana J. Andersen, Rikke B. Nordsborg, Thomas Becker, Anne Tjønneland, Kim Overvad, and Ole Raaschou-Nielsen: “Long-Term Exposure to Road Traffic Noise and Incident Diabetes: A Cohort Study.” Environmental Health Perspectives vol. 212, 2013
One study shows that a 10 decibels higher noise level at home means that the risk of high blood pressure increases by 6% and the risk of a blood clot in the heart increases by 6-8%.
There are additional indications that the risk of a stroke increases by 11%, the risk of developing diabetes increases by 11%, and the risk of heart flickering by 6%.
Nevertheless, neither the political attention nor the necessary research and construction resources have been sufficient to launch a radical showdown against traffic noise.
New methods must raise awareness of the impact of traffic noise
Over the years, we have seen that the great challenge of creating sufficient attention to the consequences of traffic noise is that it can be difficult to translate the typical methods, such as decibels and noise calculations, into a language that most people understand.
Therefore, developments are now moving towards new methods of disseminating the effects the nuisance caused by traffic noise has on people, including noise maps, audio walks, and auralisations.
Noise maps show the immediate connection between noise and noise nuisance
By presenting traffic noise on a map, it is possible to instantly show how many people are bothered by noise to some extent within a given area.
This so-called “noise pollution GIS map” may work as a dynamic map based on measuring microphones along, for instance, a road that are continuously updated.
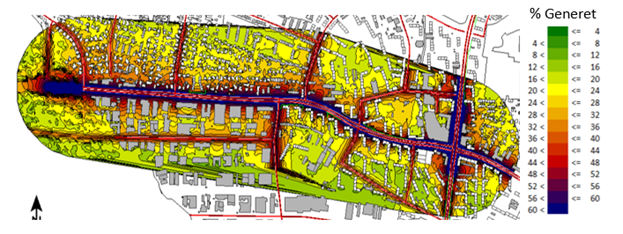
The noise map presents the noise levels visually and translates them into sizes that show the direct correlation between noise and the instantaneous noise nuisance. In addition, the noise map is simple and user-friendly, and it can be read and understood by most people.
Below, the colours of the noise pollution GIS map show the percentage of the population potentially bothered by the traffic noise.
GIS maps for illustrating noise pollution
Audio walks show experience-based audio landscapes
Audio walks are used to describe the sound landscape of an area.
Sound walks are based on local experts' experiences and replies during a walk in the area. The local experts are typically regular residents from the area. During the audio walk, they rate the sound landscape – whether it is comfortable, stressful, intrusive, chaotic or troublesome – and, of course, the volume.
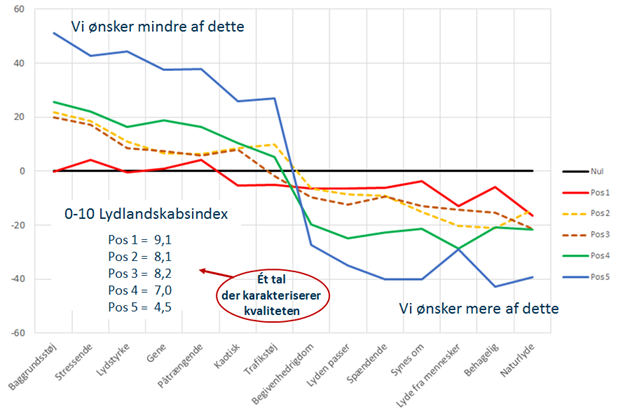
Based on the responses, a chart is drawn up, as shown in the figure below. Here you can read the responses and compare them to the desired sound landscape in the area. For instance, the example shows that there is room for improvement if all positions in the area are to have a good sound landscape.
Audio landscapes
Above is a rating of the audio landscape in five positions in an area neighbouring a large road. The graph shows the difference between the perceived level (scale 1-100) and the "desirable" level. For example, the difference between the current, experienced background noise and the desired in position 1 (red line) is almost zero, whereas it is quite large in position 5 (blue line). The audio landscape index provides a total figure for the quality of the sound landscape.
Auralisations simulate the experiences of noise
Auralisations are demonstrations of sound for a non-existent situation. For example, you can prepare an auralisation of a planned road before it is constructed.
By presenting an auralisation to neighbours or decision-makers, they get the listening impressions that will correspond to the sound of the future road and traffic at that location. Thereby, the listeners get to hear how the new road will sound, for example, at their home.
Auralisations can also be used to present the impact of noise-cancelling measures that are planned.
Auralisations are available on the web so that you can listen to them at home... Hear auralisations here.
You can die from traffic noise
In 2003, the Danish Environmental Protection Agency estimated that 200-500 Danes die prematurely every year as a result of being exposed to traffic noise. However, recent research points to much higher numbers. And new results are constantly being presented on the effects of traffic noise, which gradually makes us smarter.
So, yes - if you are exposed to noise nuisance over a long period, research suggests that you may die from traffic noise. Therefore, our new and better tools must raise awareness of the negative effects of noise and thereby increase the chances of combating the dangers of exposure to traffic noise over a long period.
If you want to know more about the new methods, you can contact us or sign up for new events.
This article was prepared under the auspices of a project in Force Technology to map knowledge about the negative effects of traffic noise on human health. The project is supported by the Danish Agency for Institutions and Educational Grants under the Ministry of Higher Education and Science.
Regarding day and night noise, calculations are made according to the Day‑Evening‑Night Level.
Lden stands for Day‑Evening‑Night Level and is used in most European countries to describe noise exposure from roads and railways in particular, but also from other noise sources.
When calculating Lden, noise occurring in the evening is weighted 5 dB higher than daytime noise. Noise occurring at night is weighted 10 dB higher than daytime noise. In other words, a noise source is weighted 10 times more if it occurs at night than if it occurs during the day.
EU, Noise abatement approaches, April 2017. Translated by Force Technology
Foraster, Maria: “Long-term exposure to road, railway, and aircraft noise levels and their association with incidence of obesity and obesity parameters”. Presentation at the ICBEN 2017 conference.
Sørensen M, Andersen Z J, Nordsborg RB, Jensen SS, Lillelund KG, et al. (2012):”Road Traffic Noise and Incident Myocardial Infarction: A Prospective Cohort Study”, https://doi.org/10.1371/journal.pone.0039283
Mette Sørensen, Zorana J. Andersen, Rikke B. Nordsborg, Thomas Becker, Anne Tjønneland, Kim Overvad, and Ole Raaschou-Nielsen: “Long-Term Exposure to Road Traffic Noise and Incident Diabetes: A Cohort Study.” Environmental Health Perspectives vol. 212, 2013
Hør den nye vej – før den bliver bygget!”. Trafik & Veje, juni/juli 2015.