How you can optimise the curing process for epoxy – and ensure the quality of your product
Many companies face quality challenges in manufacturing composites and coatings. We've identified a thermal analysis method that ensures optimal epoxy curing, reducing defects, complaints, and product recalls.
Why curing matters for quality
Although the curing process often constitutes only a small part of the production of the finished product, it is of crucial importance to its quality, thus making it valuable to optimise the curing process and thereby reducing e.g. the number of complaints and recalls of products.
The challenge for most companies is that they lack the pertinent knowledge about the process and the optimal conditions, including curing time and temperature. In addition, it is important for a company to know the robustness of the process in relation to deviations in the mixing ratio of multicomponent systems.
A broadly applicable analysis method
In order to accommodate these issues, we have identified and evaluated a thermal analysis method that can be used by companies that wish to optimise their production of thermosetting polymers/plastic systems, for example:- Resin systems in relation to composite production
- Thermosetting systems in regard to manufacturing thermosetting plastics
- Coatings - for example gelcoats, varnish and paint systems, leading edge protection coatings, and so on.
As the model curing system, a commercial bio-based 2-component epoxy system was selected, which is used typically for vacuum infusion processes and RTM (resin transfer moulding) in composite manufacturing.
Crucial to these manufacturing processes is that the curing process is carefully controlled and the optimal conditions for temperature and time are known, as well as how much or how little the mixing ratio can be deviated from, and whether it is possible to minimise the curing time and thereby optimise production of the finished product.
Documentation to customers
In addition to optimising the internal manufacturing processes, the analysis method can be used to ensure uniform quality in production. The method can also be used as an output control and implemented into the company’s quality control system. This means less discarded items and thus a more efficient production.By using the analysis, the company can ensure that the degree of curing is met and that the product or component has the specified properties which are described in the data sheet from the supplier of the epoxy components. This can help to give the company a competitive advantage on the market.
Components of this type are often used in critical and large structures such as wind turbines, where breakdowns and damages are seen regularly. In conjunction with other tests, the analytical method provides the opportunity to identify and document the cause of damage or breakdown, as it can determine whether the component or unit complies with the specified requirements for curing and thus the mechanical and thermal properties.
What can the DSC analysis be used for?
DSC (Differential Scanning Calorimetry) is a thermal analysis, whereby the heat flow to and from a test specimen is measured as a function of temperature or time, while the test specimen is subjected to a controlled temperature program in a controlled atmosphere. This method is used for example to determine a material’s glass transition temperature (Tg), crystallization temperature (Tc) at cooling and melting temperature (Tm) when heated. The temperatures are characteristic for specific plastic/resin systems, so the results can also be used in quality control contexts and for example to identify unknown/irregular materials.Evaluating the curing process with DSC
DSC can be used for the evaluation of curing rates and degree of curing for a thermosetting system (e.g. an epoxy system). The method can be used to obtain a better understanding of the thermosetting system, whereby the production time (curing time) for the composite/thermoset/coating can be minimised, and it can be used as a tool to assess the optimal curing temperature in regard to the material’s (thermal/mechanical) properties. Furthermore, the method can be used to assess how robust the process is in regards to deviations in the mixing ratios in multicomponent systems.
The heat that is generated during the curing process and the glass transition temperature (Tg) are important parameters in order to obtain an understanding of the curing of the epoxy system. The Tg of a polymer is the temperature where the material goes from a hard, solid state to a more viscous, rubbery state, so it is a material parameter that is critical for the service temperature. Tg depends on the degree of curing in a specific system, but is also dependent on the type of material.
Behind the study of epoxy hardening
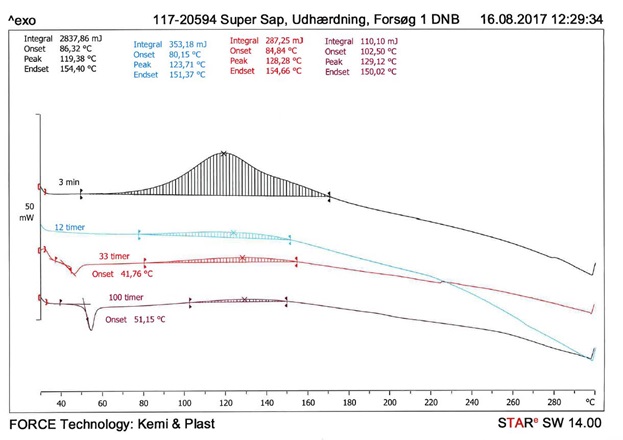
As model system, a commercial SUPER SAP INR 2-component epoxy system has been chosen, which can be applied to the manufacture of composite products for vacuum infusion and RTM. Initially the epoxy system is cured at 23 °C and subsequently post-cured at various temperatures. The degree and rate of curing the SUPER SAP INR SYSTEM is investigated using DSC. A typical DSC thermogram, which is used to assess the degrees and rates of curing, is shown in Figure 1. When curing, epoxy gives off heat, this called an exothermic reaction (as opposed to an endothermic reaction, where heat is absorbed).Heat flow is measured as a function of the time elapsed after the two components (resin and hardener) have been mixed together, and is an expression of how much epoxy remains to be cured (high degree of heat flow means highly uncured, heat flow = 0 means completely cured). Four different graphs are shown, describing the different degrees of curing (3 mins, 12 hrs, 33 hrs and 100 hrs) at room temperature.
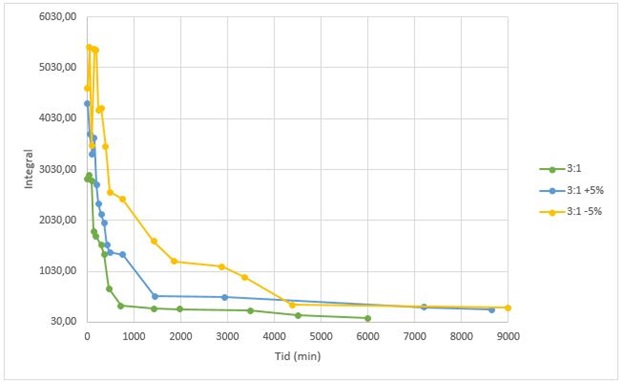
The study has been done to evaluate the method and to assess how an insufficient or excess amount of hardener (±5%) affects the rate as well as the degree of curing. It is important to remember that this is only a model system that can show trends, since only very small test amounts of 10-15 mg are used for the analysis. To assess the effect of the sample size, a DSC test was also carried out on a sample of approx. 200 g, both from the centre of the specimen and its surface.
Results of the study
Curing at 23 °C without post-curing
The two epoxy components are mixed in accordance with the data sheet and cured at 23 °C. The curing process (without post-curing) is studied as a function of time. In addition, tests with 5% more and 5% less hardener than indicated in the data sheet are evaluated (Figure 2).
The Tg is determined based on the DSC thermograms (see the example in Figure 1). It is observed that the Tg increases with the degree of curing. After 24 hours the Tg is approx. 30-40 °C, and after approx. 100 hours the Tg is approx. 50-60 °C.
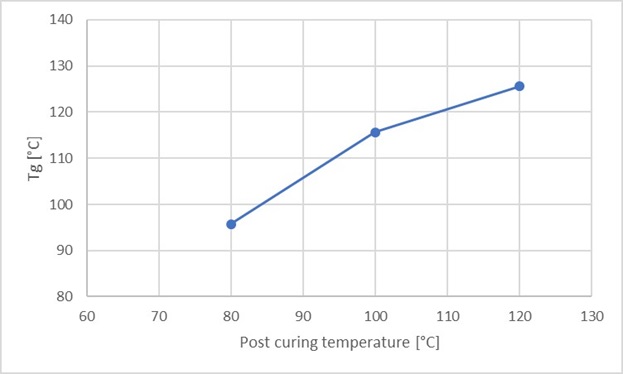
Post-curing at 80, 100 and 120 °C
For the assessment of Tg as a function of the post-curing temperature, the test samples were post-cured for 2 hours at 80, 100 and 120 °C respectively after casting. The manufacturer recommends a post-curing temperature of 120 °C for 2 hours, and states in the data sheet that at this post-curing temperature, a Tg of approx. 105 °C is obtained. Figure 3 shows Tg as a function of the post-curing temperature for a test sample of 10-15 mg. It is observed that the Tg increases at a higher post-curing temperature.
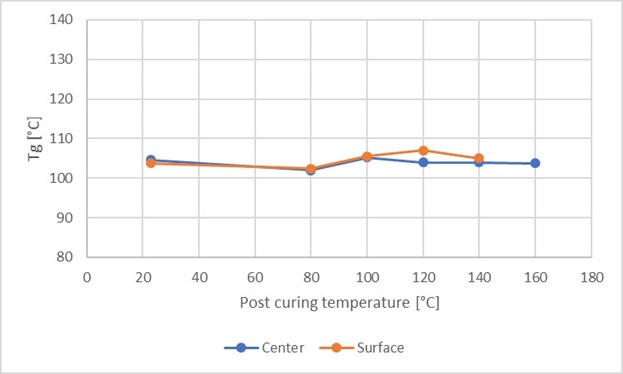
Figure 4 shows Tg as a function of the post-curing temperature for a test sample of 200 g, where both the surface and the centre have been evaluated. The same effect is not observed with small test sample amounts as with large test sample amounts, which is presumably due to the difference in the reaction in small and large samples, primarily differences in temperature due to the low thermal conductivity of the resin.
Conclusion
We have identified and evaluated a thermal analysis that can be widely used in connection with advising companies wishing to optimise their production process regards to thermosetting systems. Using the DSC method, FORCE Technology can help companies:
- Identify a specific plastic/resin system
- Evaluate the curing process and degree of curing
- Evaluate the curing rate
- Determine the Tg
- Determine the sensitivity of the curing process to deviations in the mixing ratio

Facility
Chemical analysis laboratory
Facility