Use surface assessment methods to speed up cleaning of food manufacturing
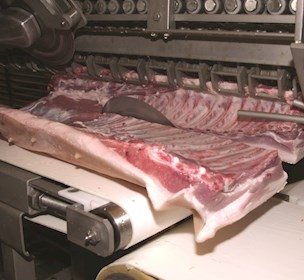
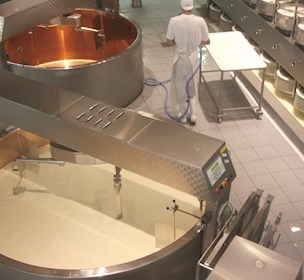
High food safety and good, uniform product quality are Danish trademarks of crucial importance for both competitiveness and exports. Achieving them requires top-notch hygiene and appropriate maintenance of production equipment.
A project entitled "Hygiene Monitoring in Closed Production Equipment" focuses on these very issues in two parallel areas:
- Rinse water measurement sensors
- Methods for surface condition assessment in closed process equipment.
This article is focused on the second area; namely, methods for surface condition assessment in closed process equipment. A future article will focus on results in the area of rinse water measurement sensors.
Challenges with biofilm removal
It is well known that biofilms form during food production, where product residues (organic matter) and microorganisms adhere to production equipment surfaces during operation. The properties of each surface greatly influence both the formation of biofilms and the effectiveness of later cleaning efforts. The better a biofilm can "hide" from cleaning fluids on uneven surfaces, the less effective the cleaning process will be.
This makes finding "invisible" cavities under production equipment surfaces important. These cavities are difficult or impossible to clean deeply, so they pose a high risk of biological product contamination. Biological contamination refers to the risk of contaminating products with micro-organisms and/or allergens.
ScoreAtlas: experiments and results
One effort within the project's second area is to develop a method called ScoreAtlas for reproducible surface condition assessments in and on production equipment in operation not only to optimise cleaning efforts, but also to assist in regular maintenance.
The method is based on a traditional quantitative inspection method called penetrant testing, where damage that is open to the surface is made visible with a combination of a penetrant liquid and a highlighting agent. The penetrant liquid can pass through damaged surfaces to fill the spaces beneath them. Then, the highlighting agent is applied to the surface, causing the penetrant to appear to "bleed out" of the opening where the surface has been damaged.
The hypothesis is that there is a linear relationship between the subsurface volume of the cavity and the amount of bleeding: the greater the damage and sub-surface volume, the greater the bleeding.
Reproducibility of penetrant tests
The first tests were aimed at determining the reproducibility of the penetrant test. A stainless steel plate with a weld with several cracks was used as a starting point, and repeated penetrant tests were carried out in a selected area of the plate. To ensure a uniform starting condition for each test, the plate was thoroughly cleaned between repetitions with (1) water, (2) an ultrasonic bath, (3) heating to 50°C to evaporate any liquid in the damaged areas, and (4) finally cooled to room temperature.
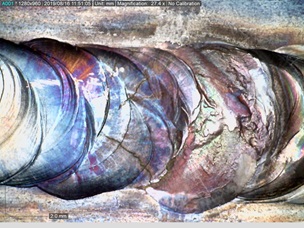
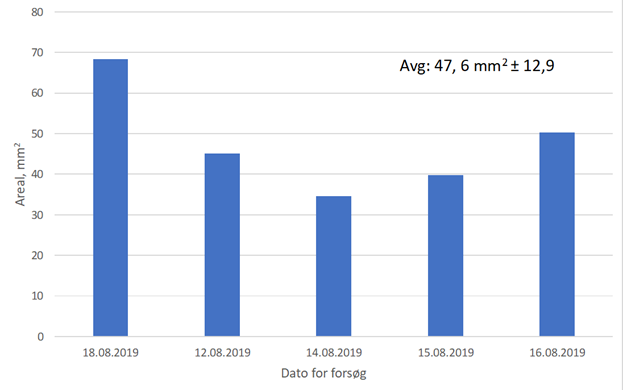
Cracks can be seen in the weld both under white light and with the penetrant under UV light (see Figure 1). Variation can be seen in the bleeding of the penetrant liquid from the cracks 10 minutes after the highlighting agent has been applied, cf. EN ISO 3452-1:2013, in fiveconsecutive tests (see Figure 2). The area of the bleed was measured with a calculation tool (ImageArea). The bleed area in each of the five trials is indicated in Figure 3.
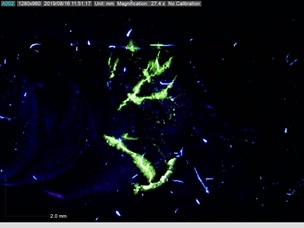
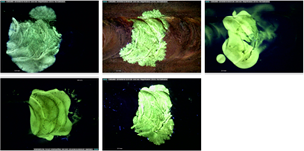
The appearance of the bleed varies from trial to trial due to differences in how the penetrant was wiped and how the highlighting agent was applied. Despite this, the bleed area from the cracks in the weld can be determined with some accuracy based on the five repetitions of the test (47.6 mm2 ±12.9). These experiments show that the penetrant test is reproducible, and that the volume below the surface can be determined with some uncertainty.
In addition to the crack welding tests, test blocks with well-defined cavities have also been tested. In this case, the volume of each cavity is known, so the experiments can give a clear indication of the relationship between volume and bleed area. Processing of data from these trials is expected to be completed in Q4 2019.
The experiments conducted up until now have shown that great care must be taken to wipe off excess penetrant liquid from the surface, and to apply the highlighting agent at the correct distance and in the correct quantity to the surface of the object under testing. This experience will form the basis of a procedure description that the project is expected to deliver.
It is expected that a categorisation system for the size and depth of defects, cracks, and pittings in stainless steel surfaces can be developed based on these experiments and interpretations of their results. The categorisation system is expected to form the basis of an industry standard with acceptance criteria, similar to the colour atlas currently used in the welding industry.
Surface openness and cleanability
The most difficult surfaces to clean are those with deep and narrow recesses (see Figure 4b). Even with low-surface-tension cleaning fluids , it can be difficult to effectively reach the bottom of these recesses. Compared to the surface in Figure 4a, this surface will be somewhat easier to clean, as the depressions in the surface of the material are not as narrow.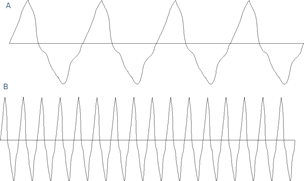
The commonly used roughness parameter, Ra, expresses how deep the depressions are measured along a line, while Sa expresses how deep the depressions are, measured over an area of the surface. However, describing the difficulty of cleaning a surface also requires information on the number of depressions that occur along a line or over an area; in other words, how narrow and tightly spaced they are. The deeper and narrower the de[depressions, the more difficult it is to get the cleaning liquid all the way to the bottom, so as to effectively wash away the biofilm. This parameter can be expressed as the "density of summits". For line-based roughness, this is Rds, measured in peaks per µm; for area-based roughness, the corresponding parameter is Sds, measured in peaks per µm2. Cleanability can thus be expressed as the inverse of Sa*Sds or Ra*Rds2. Therefore:

Whereas SRV indicates cleanability measured over an area of the material, RRV indicates cleanability measured along a line on the material. Since Ra is direction-dependent while Sa is direction-independent, and since cleanability is clearly a surface property, it is likely that cleanability measured over an area of the material, SRV, will serve as the best parameter for assessing the cleanability of a surface.
Why is this surface openness value relevant?
Today's use of roughness measurements (Ra) as the only parameter for surface properties is insufficient, as it does not provide information on the openness of the surface, and by extension, its cleanability. Two surfaces with the same Ra value may yet be very different in terms of cleanability. This is because the cleanability of a surface depends on its openness. A more open surface will have fewer acute angles along its depth compared to a less open surface (see Figure 5).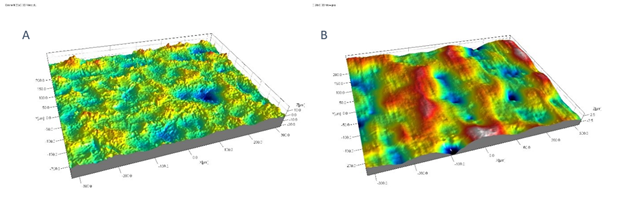
Food manufacturing businesses often want to be able to clean as quickly and efficiently as possible while ensuring food safety and quality. Saving just a few minutes per cleaning adds up to many hours saved per year. Looking at the total resource consumption (water, electricity, cleaning chemicals, "lost production" and "staff time" during cleaning), shaving a few minutes off of the cleaning time can result in significant savings.
Today's requirements address only the roughness of surfaces, but we can only wonder whether food manufacturing companies might start imposing surface openness requirements on new equipment if studies find that doing so makes cleaning significantly easier, and that valid target values for cleanability can be specified.
Achieving faster, more efficient cleaning
In anticipation of these demands, FORCE Technology has begun working on establishing a formula for these specifications. The formula and the values it produces are slated to be verified in cleaning experiments later in the year.
The new surface condition assessment methods will facilitate the use of smoother surfaces that allow for quick and effective cleaning. The first part, ScoreAtlas, will primarily be used with existing equipment, as its results will be useful in conducting regular equipment maintenance. However, ScoreAtlas will also be valuable for third-party inspections of new equipment. The second part, concerning surface openness and cleanability, will primarily be applied to new equipment, as it will be ideal for inclusion in requirements specifications along with other hygienic design requirements. In this way, food manufacturers can be certain that purchased equipment can be kept clean.
Together with a focus on hygienic design, the new surface condition assessment methods will help to facilitate faster, more effective cleaning to support first-rate food safety and product quality standards.

Annette Baltzer Larsen
Project