Uncertainty explained: Understanding an uncertainty budget
Which factors are important to know and address when working with uncertainty budgets? Let us try to explain.
In order to understand uncertainty calculations and budgets, it is necessary to know how a calibration result is reached. We have explained calibration calculations in this article, that can be relevant to read before you read about uncertainty budgets.
Read: Uncertainty explained: How a calibration result is reached?
Components in a laboratory’s uncertainty budget
When working with uncertainty budgets, a laboratory not only has to evaluate the factors of the formula, but also address a variety of assumptions needed for the calculation.
Line pack changes
First, we assume that there is no line pack, meaning that there are no that is changes in gas amount between WS and MUT. For this to be true, there should be no pressure and temperature changes between the WS and the MUT.
Leakage in the system
Secondly, we assume that there is no leakage in the system that can influence the calibration results. Calibration laboratories need procedures to ensure such assumptions and evaluation of whether there is a need to attach an uncertainty to such assumptions or not.
Drift /Stability
Another important assumption is that of drift, sometimes also called stability. This is especially important for the error of the WS. Although the WS has been calibrated with an uncertainty of 0,10%, the total uncertainty of the error of the WS also needs to include the stability of it. If it is calibrated every 3 months, there is a lot of data to support assumptions of this stability, as it is calibrated often, and it will likely not drift much during 3 months, so the drift uncertainty can be set low.
In the case of FORCE Technology, we calibrate the WS every 3 years, but have various control activities in between the calibrations to ensure and monitor the stability of the WS. Even still, the drift uncertainty of the WS is one of the major parts of the total uncertainty when calibrating a MUT. This drift uncertainty also needs to be accounted for in the case of pressure and temperature measurements but does not influence the total uncertainty significantly.
Calibration curve
Finally, for WS, a calibration curve/function is used that is based on the errors found in the calibration of the WS. Because we use such a curve, an extra uncertainty is added based on the residual errors, which is the difference between the calibration curve results and the actual calibrated results.
Read more: Uncertainty explained - How to calculate the laboratory CMC?
Smart methods that calibration laboratories can make use of to lower calibration uncertainty
The article How is a calibration result reached? showed how a calibration result can be reached with:

One important way of lowering uncertainty of a MUT is by using multiple WS. The WS’s calibrated error is close to 100% correlated, and 100% correlation will increase the uncertainty, but the drift of the WS is not. By using multiple WS, uncertainty can be reduced, although never lower than the shared uncertainty of the WS that stems from the same traceability.
Another way of using this can be done with measurement devices, in the case of pressure, this is done by thinking not about how to lower the uncertainty of the individual pressures PMUT and PWSbut by lowering the uncertainty of PMUT/PWS . Since pressure transmitters have a relatively high random uncertainty compared with differential pressure transmitters, the uncertainty of this value can be lowered by using a differential pressure transmitter between the WS and MUT and only measuring absolute pressure at one of the locations, which in the case of FORCE Technology is at the MUT.
So, in our case

and this value has a very low uncertainty since PMUT is the dominating factor with regards to uncertainty. We have thus made the numerator and denominator correlated and, by doing that, the uncertainty is lowered.
With regards to temperature, all WS and MUT transmitters are calibrated together at the same time, so a calibration error would result in the same error, both for the MUT and the WS. This means that the uncertainty of calibration of the reference temperature, used to calibrate the WS and MUT temperature transmitters, has negligible impact on the uncertainty in the calibration of a gas meter, since such an error would, in the expanded calibration result equation, impact the numerator and denominator in the same way.
The compressibility factors
Another factor that must be addressed as well is the compressibility. According to ISO12213, the compressibility has an uncertainty of up to 0.10%. If we were to use that uncertainty for both compressibilities in the expanded calibration result equation, they would be dominating factors with regards to the total uncertainty.
But as with the pressure and temperature, what we need to know is not the compressibilities and their uncertainties, but the uncertainty of ZWS/ZMUT. Since we have the same gas composition and almost the same pressure and temperature, what becomes important, as with pressure measurement, is the differential compressibility - and the uncertainty of that is very low.
What this means in practical terms, is that uncertainty contributions towards the model equation in the expanded calibration result equation from pressures, temperatures and compressibilities, do mostly cancel each other out as they exist both as numerators and denominators in the model equation.
Having looked at all these factors, and how their uncertainty contributions towards the model equation can be mitigated, it is now time to look at the end product, an uncertainty budget.
Read more: Uncertainty explained - Class half meters
The Uncertainty Budget
Based on this, we can now make use of an expanded uncertainty equation:

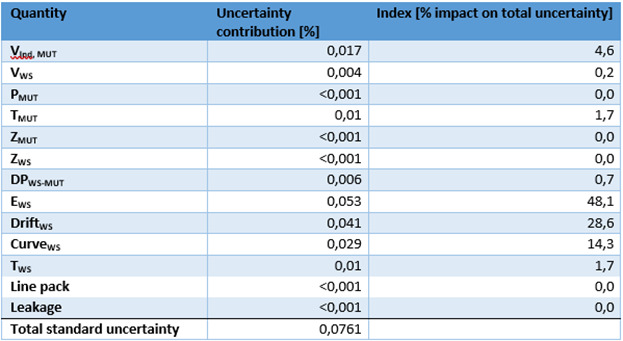
The table below sums up the uncertainty contributions of the major factors that influence uncertainty at FORCE Technology when a MUT is calibrated with one WS. The uncertainty contributions are based on typical values for the quantities that we might see at the high-pressure calibration laboratories at FORCE Technology.

Note, that all the uncertainties in table 1 are standard uncertainties, and the total standard uncertainty is the root sum of squares of all the uncertainty contributions. In the case of line pack and leakage, they could influence calibration results and thus uncertainty at low flowrates. But, as the table above is for calibration at high flowrates (compared to the size of the calibration loop), the factors have little to no influence on the calibration results.
We can see in the above table that the biggest influencers on the total uncertainty are the errors of the working standard, its allowed drift and calibration curve.
The case above is relevant when one WS is used to calibrate a MUT. If we were to look at the uncertainty quantities and contributions when flow is distributed equally among 4 WS to calibrate a MUT, the combined influence of EWS is approximately the same, because the errors of the WS’s are highly correlated, but these random drift and curve factors would be equally distributed among 4 WS’s, so the combined uncertainty contribution of the drift would become

This means that its impact towards the squared uncertainty lowers by a factor 4 and the collective index of drift lowers by a factor 2.7. The same method can be used to show how the contribution for the calibration curve lowers by the same factor as the drift. So, in the case where many WS are used to calibrate a MUT, the standard uncertainty lowers and becomes approximately 0,06.
In calibration, uncertainty typically has a normal distribution, and a calibration result should be reported with an expanded (k=2) uncertainty. This means that the uncertainty is reported as a 2 x standard uncertainty which corresponds to a 95% confidence.
For the example in table 1, that means that the UCMC is 2×0,0761=0,1522%. So, if a laboratory reports an error y% with an uncertainty of x%, then there is a 95% chance that the actual error of the meter is between y-x% and y+x%.
Total uncertainty is the combination of the uncertainty of the calibration facility and the uncertainty or repeatability of the MUT. The repeatability of the MUT is calculated based on successive measurements, the more measurements there are, the lower is the uncertainty of the average error.
Several methods exist for how this is calculated, but the method below is based on how it is done at FORCE Technology.


How can calibration laboratories verify an uncertainty?
As with all such complex systems, the uncertainty budget needs to be verified in some way. An easy way to practically do this, is to perform inter-comparisons.
Inter-comparisons ensure that the assumptions we have made about uncertainty in the calibration system are valid. Inter-comparisons are performed between at least two laboratories, where a MUT is calibrated by the laboratories over a short period of time, and the results are compared.
Based on the differences between laboratories, and the uncertainties reported by the laboratories, it is possible to verify or, at the very least, support the uncertainty claims of laboratories. FORCE Technology participates in many inter-comparisons every year. Many of them are “official” through EuReGa and Euramet, while others are informal inter-comparisons that either we or other participants initiate to support new uncertainties, or just to maintain current uncertainties.
Symbols
The equations used in this article use symbols that are based on what is normally used in international standards and documents. Table 2: Symbols and their description.
| Symbol | Description |
|---|---|
| MUT | Meter Under Test, also sometimes called DUT (Device Under Test), is the meter/device that is being calibrated. |
| WS | Working Standards are reference meters, used to calibrate a MUT. |
| P | Pressure, where PWS would be pressure at the WS and PMUT would be pressure at the MUT. Pressure is always measured in absolute pressure. |
| T | Temperature, where TWS is temperature at the WS and TMUT is temperature at the MUT. Temperature is always measured in Kelvin. |
| Z | Compressibility, where ZWS is compressibility at the WS, and ZMUT is the compressibility at the MUT. |
| V | Volume, where for example VIND, MUT is the indicated reading from the MUT during the calibration, and VActual, MUT is the actual volume at the MUT based on WS readings, pressures, temperatures and compressibility. |
| Q | Flowrate, that is [Volume/time unit] where for example QIND, MUT is the indicated reading from the MUT over a specific time and QActual, MUT is the actual flowrate at the MUT based on WS readings, pressures, temperatures, compressibility and time. |
| t | Time in seconds, where during a calibration if a timer starts and stops a calibration, the time is the same for the WS and a MUT. |
Table 2: Symbols and their description.
Related content

MEGA loop inaugurated
/News
EMCO Controls' choice for accurate calibration
/Case
Precise measuring instrumentation is imperative in the global custody transfer infrastructure.
High-pressure calibration of metering lines
/Case
Emerson are left with a verification that guarantees their customers accurate custody transfer.
MEGA loop revitalised
/News
The proportions of the MEGA loop will open up new possibilities for calibrating long meter systems.
Reducing operational uncertainty in gas transfers
/Article
Importance of managing fiscal risk in large volume gas custody transfer.
Uncertainty: How is a calibration result reached?
/Article
To understand uncertainty calculations, it is necessary to know how a calibration result is reached.
Uncertainty explained: How to calculate laboratory CMC?
/Article
What is CMC, and how does it involve the uncertainty of the laboratories?
E-guide: Understand calibration certificates
/Article
Learn how to read, interpret and understand gas calibration certificate with this e-guide.
Uncertainty explained: Class half meters
/Article
Most laboratories in the world don’t have uncertainty levels adequately low to perform accredited calibrations of a class half meter. How does this affect the gas metering industry?
5 arguments for re-calibration of gas meters
/Article
Why perform re-calibration of gas meters? 5 gas industry professionals share their opinion.
8 things to remember when shipping gas meters to a calibration facility
/Article
We have gathered our best tips to successful shipment of your gas meters.


